

Introduction
The phenomenon of global climate change poses a significant threat to the survival and development of Earth’s organisms. This threat is primarily attributed to the impact of greenhouse gases, with CO2 being a prominent contributor to the ongoing changes in the global climate [1]. Hence, in response to the escalating challenge of climate change, it is imperative for individuals to proactively engage in endeavors aimed at mitigating Carbon Emissions (CE). Furthermore, it is crucial for individuals to prioritize the establishment of an ecological economy and explore innovative approaches to low-carbon development through the study of CE estimation and compensation. The advent of a low-carbon economy has also given rise to the concept of “low-carbon tourism,” which has gained prominence in recent times [2]. Compared to other industries, developing low-carbon tourism has a more significant effect on reducing CE. In this context, rural tourism has developed rapidly [3]. According to relevant surveys, 75% of tourism resources in China are concentrated in rural areas. As of the end of 2022, China has over 500 national level tourist rural scenic spots [4]. Rural tourism is a pivotal component of the contemporary tourism industry, gaining increasing popularity among individuals. Pandita S and other esteemed scholars conducted a bibliometric analysis to assess the CE of tourism, employing open-source software for similarity visualization to process the amassed data. This research held significant reference value in determining the sustainable development trajectory of the tourism industry [5]. Wang Y and fellow researchers adopted a bottom-up approach to gauge the CE of domestic tourism in China, complemented by a Granger causality test on the pertinent data. The findings indicated a steady rise in China’s tourism industry CE, with the transportation sector exerting a notable influence on the overall CE of the tourism industry [6]. Luo F et al. estimated the CE of China’s tourism industry by constructing the China Economic Environment Account. The results showed that the direct CE and total CE of the tourism industry accounted for 0.7% and 2.7% of China’s total CE, respectively [7]. Razzaq A et al. analyzed the impact of international tourism and green technology on national economic growth and CO2 emissions from 1995 to 2018. This study showed that tourism could drive economic growth, and green technology innovation could promote economic growth while reducing CO2 emissions [8]. To study the relationship between tourism, economic growth and CE, Akadiri S and other scholars designed a framework to introduce globalization index. The empirical analysis showed that the main factor leading to CE was the inner region of the tourist destination, and the tourism economy was in direct proportion to CE [9].
Denton G et al. conducted in-depth research on the determinants of tourists’ attitudes towards carbon compensation, as well as the role of gender in cognitive assessment and attitude formation. The conclusion was that tourists’ objective knowledge, subjective knowledge, trust, and credibility significantly affect their attitude towards carbon compensation to varying degrees [10]. Researchers such as Bhaktikul K have constructed a sustainable low-carbon tourism system for rural communities by integrating environmental and economic goals in community development. By conducting qualitative and quantitative data analysis at different stages, the performance results could serve as guidelines for the sustainable development of low-carbon communities [11]. Due to the lack of application and theoretical achievements of current carbon neutrality, Wu X et al. conducted in-depth analysis on carbon neutrality. This study proposed a method to measure carbon neutrality capacity and cost, which plays an essential role in reducing CO2 emissions and achieving ecological environment protection [12]. Pan Y et al. calculated tourism CE efficiency built on the super efficiency Slacks measure and Data envelopment analysis model. On this basis, they defined the composite system of tourism CE, economic development, and regional innovation. This proved that the development trend of coupling fineness between provinces was good, and the tourism CE efficiency showed a reciprocating trend of first rising then descending [13]. Eyuboglu K. et al. used three co-integration tests to analyze the relationship between tourist numbers, energy consumption, economic growth, and CE. The research showed the tourism industry, economic growth, and energy consumption were greatly affected by CE [14].
In conclusion, there are several key gaps in the research of rural tourism CE assessment and compensation. First of all, it is difficult to obtain data, especially accurate data of multiple emission sources such as transportation, accommodation and activities in the process of tourism, which is especially scarce in rural areas. Secondly, the CE assessment method specifically for rural tourism is not yet perfect, and there is a lack of universally recognized standardized guidance and models. In addition, carbon offsetting mechanisms in rural areas are under-developed, and existing mechanisms are often not effectively integrated into local socio-economic and environmental characteristics. In addition, the socio-economic impacts of rural tourism, such as the connection between local lifestyle and economic conditions, as well as environmental benefits and compensation, have not been deeply explored. At the policy level, there is a lack of specific norms for the sustainable development of rural tourism, CE reduction and compensation. Finally, the lack of a long-term monitoring and evaluation system makes it difficult to accurately measure the actual impact of rural tourism on CE and the compensation effect. Songkou Town, situated in the southwestern region of Yongtai County, Fuzhou City, holds the distinction of being the sole historical and cultural town in Fuzhou. Recognized for its cultural significance, the town was included in the fourth batch of renowned historical and cultural towns (villages) in China by the Ministry of Housing and Urban Rural Development of the People’s Republic of China and the National Cultural Heritage Administration in 2008 [15]. As Songkou Town actively embraces the paradigm shift in economic development known as the New Normal, it has successfully established a distinctive brand in rural tourism. The rapid growth of rural tourism in the region has consequently led to an increase in the overall CE of Songkou Town. Therefore, the study on CE in the context of rural tourism development in Songkou Town holds significant representativeness. This research is grounded in CE theory and aims to construct a comprehensive theoretical framework, CE system, and estimation methodology specifically tailored to rural tourism carbon sources. Additionally, it proposes corresponding strategies for carbon compensation. The ultimate objective is to address the existing limitations in the implementation of a low-carbon rural tourism economy and its carbon compensation practices, while providing practical insights and guidance for promoting low-carbon development and safeguarding the ecological environment.
Material and Methods
Construction of CE Estimation Model in Rural Tourism Development
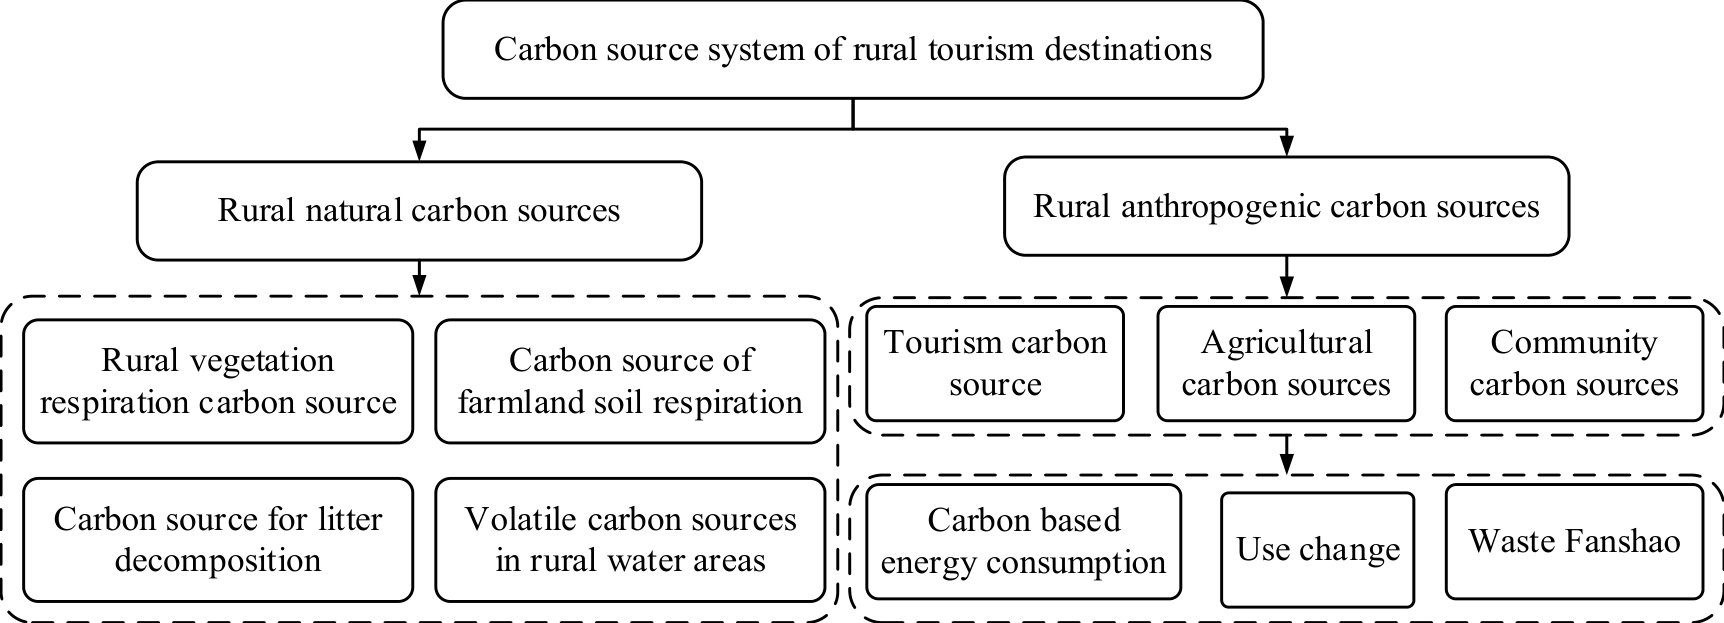
Rural tourism destinations are a diverse and open composite system composed of nature, society, and economy. In this system, the CE process includes two aspects: natural and human processes. Carbon sources are divided into natural and anthropogenic carbon sources. The natural carbon source of rural tourism refers to the process and activity of emitting CO2 in the natural ecosystem of rural tourism [16]. The anthropogenic carbon source in rural tourism refers to the production of a large amount of CO2 in various activities of rural tourism and agricultural production [17]. Fig. 1. shows the carbon source system of rural tourism destinations.
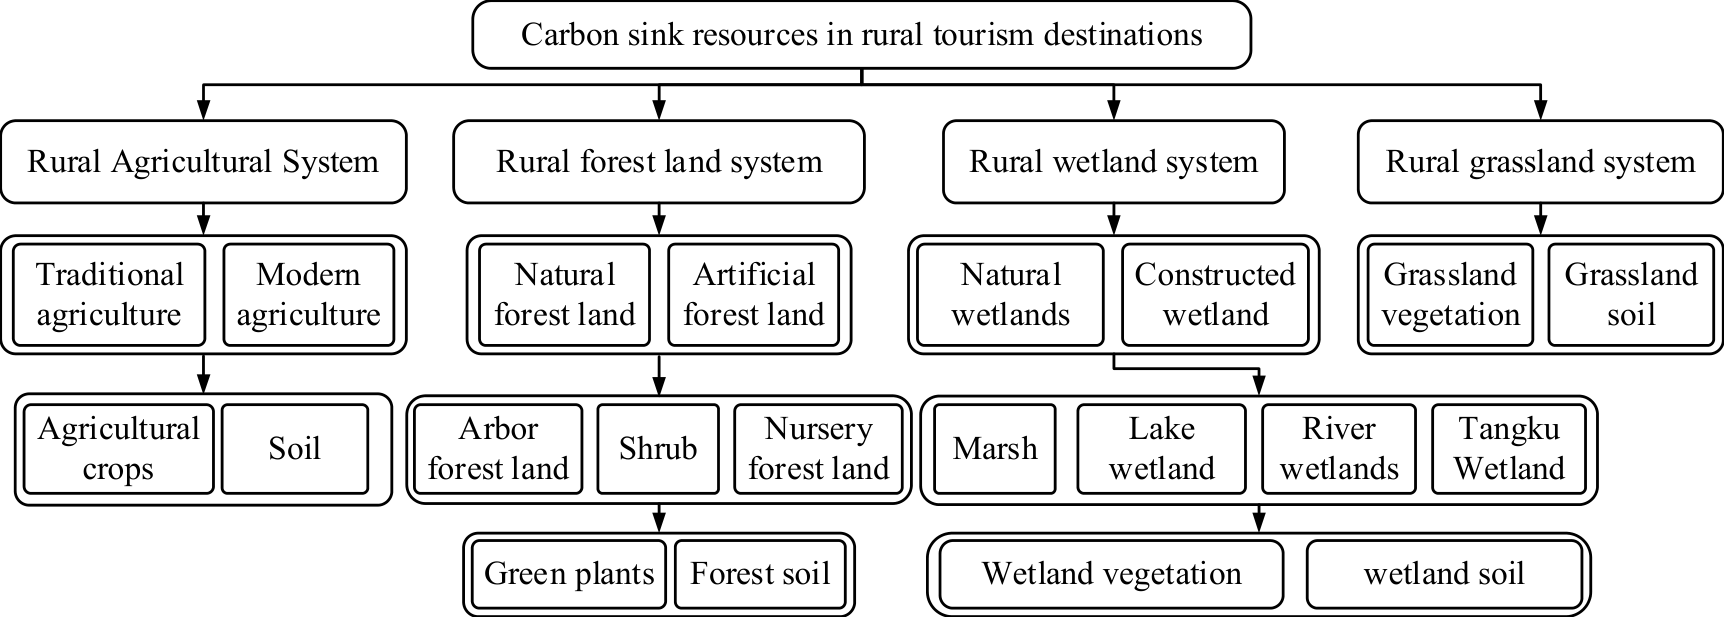
In Fig. 1., the natural carbon sources in rural tourism areas mainly include the green vegetation autotrophic respiration. It converts CO2 in the atmosphere into plant carbon through plant photosynthesis, thereby affecting the CO2 concentration in the atmosphere. Heterotrophic respiration in farmland soil refers to the absorption of CO2 by plants in the farmland soil, while releasing CO2 from the atmosphere into the soil. The carbon source of litter decomposition is the CO2 released from the decomposition of plants and soil. Volatile carbon sources in rural water bodies refer to the absorption and conversion of CO2 emitted by plants and water bodies into organic matter, thereby affecting the concentration of CO2 in the atmosphere. In rural tourism areas, anthropogenic carbon sources primarily encompass three aspects: tourism carbon sources, agricultural carbon sources, and community carbon sources. Specifically, the consumption of carbon sources is predominantly associated with fossil energy usage in the tourism, catering, and accommodation sectors. Rural tourism destination carbon sink refers to the natural ecosystem elements and areas that can remove, absorb, and store atmospheric CO2. In different natural ecosystems, there are differences in vegetation carbon absorption and soil carbon storage rates. Considering this and combined with the composition of terrestrial ecosystem carbon sink base, a carbon sink system for rural tourism destinations has been constructed. Fig. 2. shows the carbon sink system of rural tourism destinations.
In Fig. 2., the carbon sequestration system of rural tourism destinations comprises four key components, namely the rural agricultural system, rural forest land system, rural wetland system, and rural grassland system [18]. Among these, the CE from rural agricultural systems encompass both traditional and modern farming practices. Traditional agriculture relies on crop photosynthesis, while modern agriculture incorporates advanced techniques such as mechanization, fertilization, and irrigation to enhance crop yields. The rural forest land system encompasses both natural and artificial wetlands. Natural wetlands encompass lakes, swamps, rivers, ponds, and reservoirs, while artificial wetlands refer to marshes constructed on land, containing soil rich in plant nutrients. The primary carbon sources in wetlands are derived from swamps, lakes, rivers, vegetation, and soil in ponds and reservoirs. The CE in the rural grassland system originate from grassland vegetation and soil, which contribute significantly to carbon sequestration in rural areas, facilitating sustainable development. Fig. 3. illustrates the mechanism by which carbon sink resources impact rural tourism destinations.
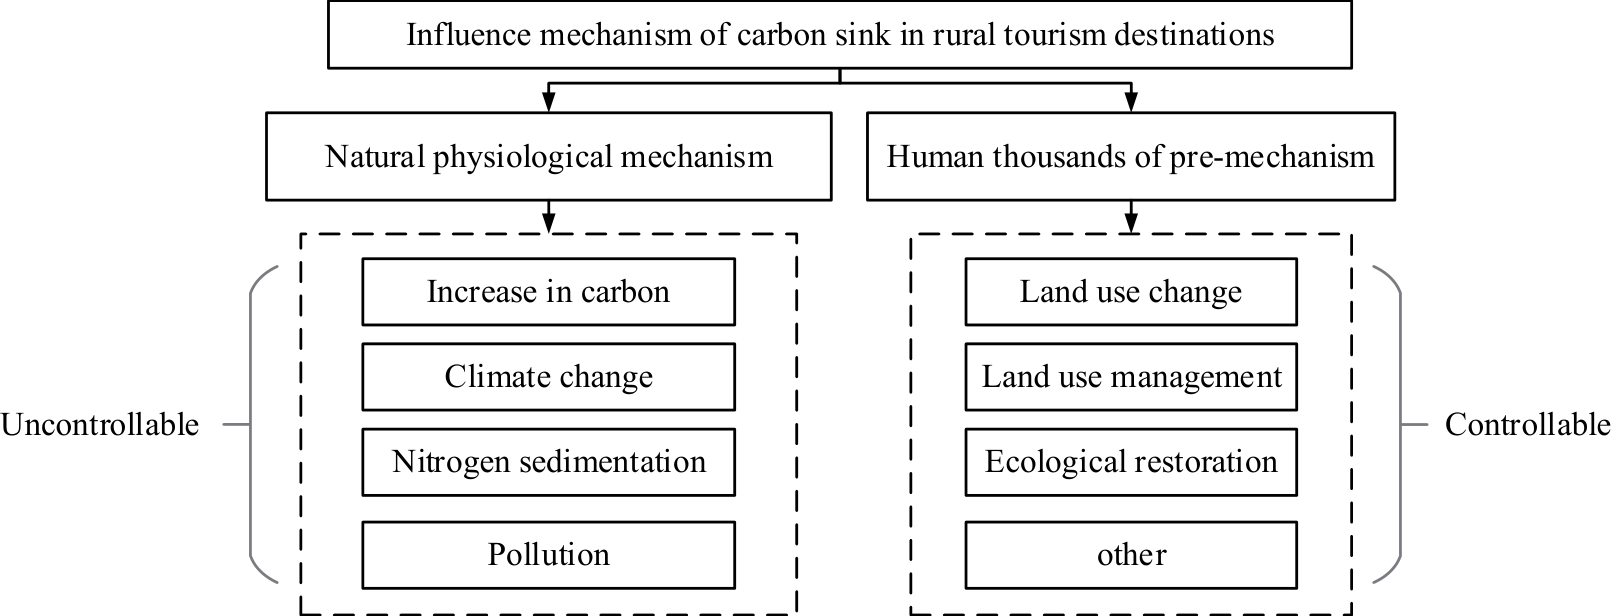
In Fig. 3., the impact mechanisms of carbon sink resources in rural tourism destinations are primarily categorized into natural mechanisms and artificial mechanisms. The natural mechanism encompasses ecological processes that affect the carbon sink function of rural tourism destinations under various factors such as heightened carbon concentration, climate change, nitrogen deposition, elevated CO2 concentration, and pollution. Climate change primarily pertains to the rise in global temperature and reduction in rainfall, leading to an elevation in atmospheric CO2 concentration (specifically, an increase in CO2 content in the global atmosphere). Pollution primarily denotes the release of air pollutants from rural tourism destinations. Nitrogen deposition refers to the substantial presence of nitrogen in the soil of tourist destinations, which can be assimilated by plants and stimulate plant growth. The human intervention mechanism primarily refers to alterations, interference, or management of land use/cover patterns in rural tourism destinations. To rehabilitate degraded rural ecosystems, it is imperative to implement effective management measures aimed at enhancing environmental quality, augmenting soil nutrients and air moisture, and increasing forest coverage.
The CE estimation adopts the anthropogenic CE estimation method in rural tourism areas to obtain the CE of the region. When establishing a CE prediction model for rural tourism, it is vital to comprehensively consider the main carbon sources such as tourism consumption, agricultural production consumption, and waste incineration [19]. Different evaluation methods can be used for different carbon sources to meet different needs. Under different modes and purposes of travel, there will also be significant differences in their CE. Equation (1) is used to construct the CE estimation expression for tourism links [20].
The GEtraffic in Equation (1) represents the CE of the tourist destination per unit time, and it is necessary to consider the CE of different modes of transportation simultaneously. This includes external transportation CEExternal, central transportation CEcentral, and internal transportation CEinside in tourist attractions. The CE estimation of tourism accommodation only takes into account the CE generated by the energy consumption of various accommodation and services within the tourist attraction. These CEs include CE generated by energy consumption of household appliances such as housing lighting, television, and heating [21]. The calculation of CE from the accommodation sector is expressed as Equation (2).
Fig. 3.
Study on ecological services of carbon sink resources and their mechanism in rural tourism destinations.
In Equation (2), EQj represents the energy consumption of j types in the i-th store for accommodation. CFj represents the conversion of j energy consumption into standard coal coefficient. CFce is the coefficient of CO2 emissions from standard coal, with a value of 2.45. The estimation of CE from tourism and catering requires considering the various energy consumption used in catering, including traditional natural gas energy consumption, traditional coal energy consumption, and catering electricity consumption. The entire calculation of CE does not include the energy consumed during the transportation of raw materials. The energy consumption of catering needs to be obtained through on-site research to obtain relevant data. The CE of tourism and catering are similar to those of the accommodation sector, and their calculation expression is demonstrated as Equation (3) [22].
The CE estimation of scenic area management needs to consider the energy consumption in various aspects of the tourism management process. This includes environmental protection, scenic area maintenance, daily operation and management of scenic areas, and scenic area service management. The management work of the scenic area will ensure the maintenance of the daily work of the scenic area [23]. The CE in scenic area management mainly comes from two aspects: firstly, the office consumption of scenic area management places, and secondly, the commuting consumption of scenic area management personnel [24]. The calculation expression of scenic area management CE is Equation (4).
In Equation (4), CEmanagement represents the operating company’s energy CE, and the total emission management consists of commuting CEoffice and CEcommuting. In addition, it is also necessary to consider the CE caused by the combustion of rural solid waste. Solid waste incineration will directly emit a large amount of CO2, and its calculation expression is Equation (5) [25].
In Equation (5), CSwaste represents the total amount of solid waste emissions, and IW represents the total combustion amount of Class i solid waste. dm is the dry substance in Class i solid waste, and CCW is the carbon content in Class i solid waste. FCF represents the mineral carbon content in Class i solid waste, while EF represents the proportion of mineral carbon to total carbon in Class i solid waste. In the process of developing rural tourism, it is necessary to fully consider the factors of CE and carbon absorption. The natural space of rural tourism areas includes various types of ecological habitats. The ecological function of carbon sinks is closely related to the storage and absorption of carbon. In the calculation of carbon absorption in rural tourism, the construction of a rural carbon absorption model has been completed based on the estimation parameters and coefficient method of ecological carbon sinks. Equation (6) is the calculation of carbon absorption in rural tourism destinations.
CS in Equation (6) represents the total system carbon absorption of rural tourism at a certain point in time. CSvg is the carbon absorption of ecological plants. CScrop represents the carbon absorption of agricultural crops, and CSwater represents the carbon absorption of water wetlands. Rural ecological plants play a crucial role in maintaining the stability of ecosystems, and their photosynthesis can convert CO2 in the soil into storable substances. The carbon absorption expression of rural ecological plants is Equation (7) [26].
In Equation (7), Ccg.i represents the carbon absorption coefficient of i plants. Area represents the plant area. Carbon sequestration in crops mainly refers to the absorption and utilization of photosynthesis by cash crop. Economic crops absorb a large amount of carbon dioxide through photosynthesis, which is stored and converted into the energy needed for plant growth. Equation (8) is the calculation process for the carbon absorption of crops [27].
In Equation (8), CScrop.i represents the carbon absorption of i economic crops. Ybio.i is the carbon absorption coefficient of i economic crops. Ybio.i represents the economic output value achieved by i economic crops. In the process of carbon absorption in wetlands, the absorption and fixation of CO2 by aquatic plants in wetland waters are mainly considered. Wetland water bodies include carbon absorption and carbon sequestration in dry and wet environments, as shown in Equation (9) [28].
In Equation (9), Cu–water represents the carbon sequestration rate of rivers and lakes. Cmrar refers to the carbon fixation rate of mudflat. Awater represents the total area of the river and lake. Amud refers to the total area of mudflat. And A represents the single dry wet settlement area. Csub represents the input coefficient of single dry wet deposition carbon.
The Construction of Carbon Compensation Mechanism in the Development of Rural Tourism
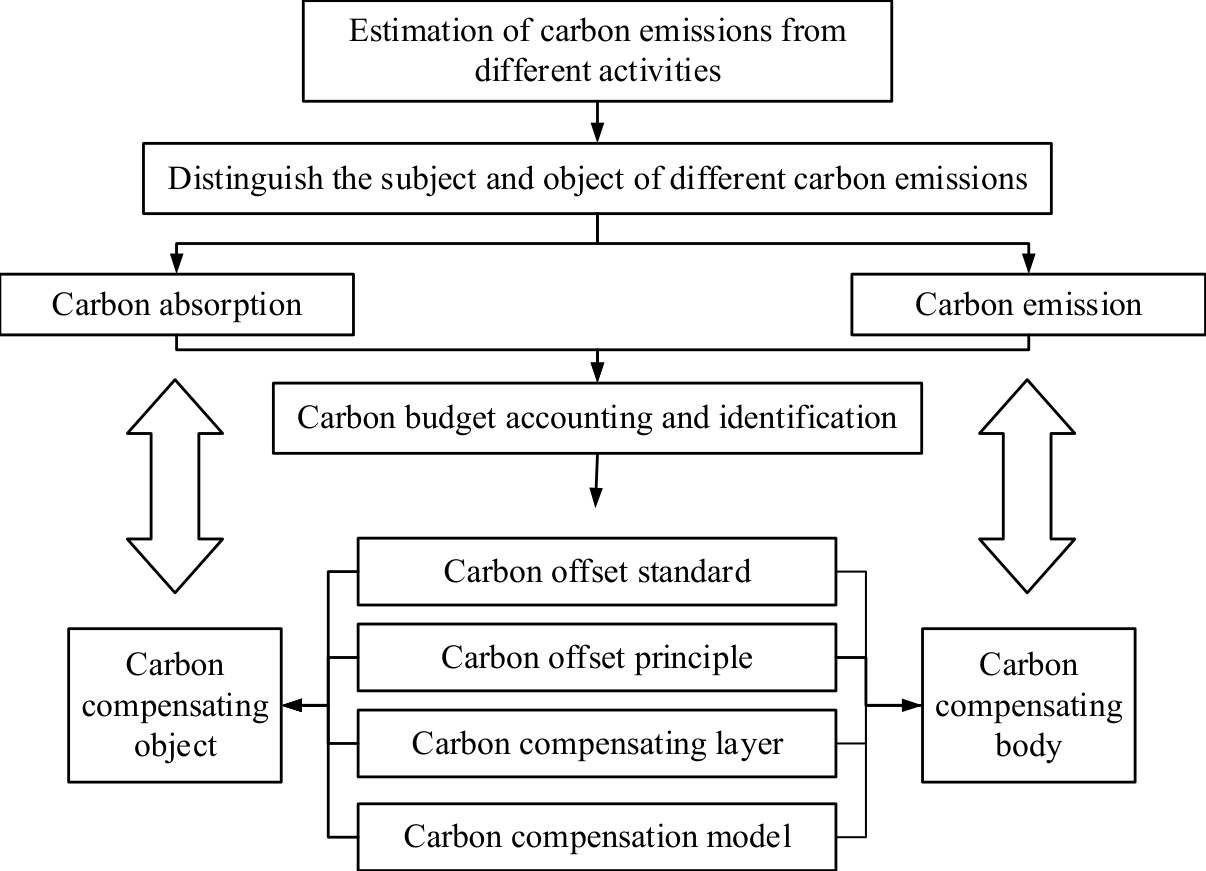
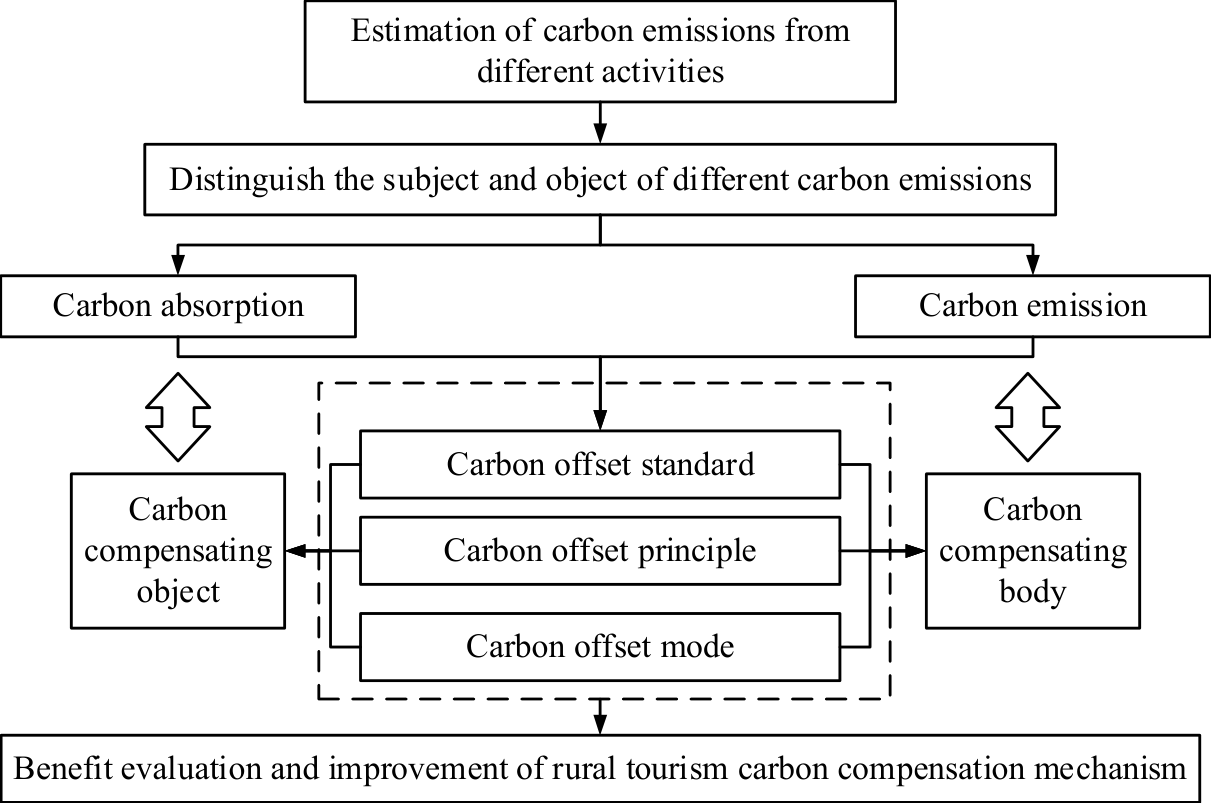
Ecological compensation is formulated based on a synthesis of various disciplines such as ecology and economics [29]. It explores diverse mechanisms for compensation across four key dimensions: planning, management, market, and technology. This undertaking primarily encompasses the identification of compensation beneficiaries, the establishment of compensation criteria, the determination of compensation methods and approaches, process administration, and the pricing of carbon in the market. Carbon compensation, a burgeoning area within ecological compensation research, follows a three-step process to attain carbon neutrality. Initially, CE is quantified, which then serves as the basis for formulating corresponding emission reduction strategies. Ultimately, the aim is to offset unavoidable CE through compensation [30]. Fig. 4. illustrates the framework of the carbon compensation mechanism.
In Fig. 4., firstly, carbon compensation is generally carried out according to the principle of “whoever emits pays, whoever absorbs receives compensation” [31]. Compensation can be divided into government compensation, individual compensation, enterprise compensation, land use compensation, and regional horizontal compensation based on different subjects. Secondly, the assessment criteria of carbon compensation can be in line with the opportunity cost method, market price method, carbon tax law, shadow price method and other methods to assess the cost of CE. Then the compensation amount for each party is determined in line with the evaluation results. Thirdly, China uses the opportunity cost method to determine the carbon compensation standard. Finally, based on carbon compensation, the ecological benefits of carbon compensation schemes are evaluated, providing suggestions and opinions for improving carbon compensation mechanisms. Fig. 5. shows the basic framework of carbon compensation mechanism and the rural tourism carbon compensation mechanism constructed on the ground of the characteristics of rural tourism.
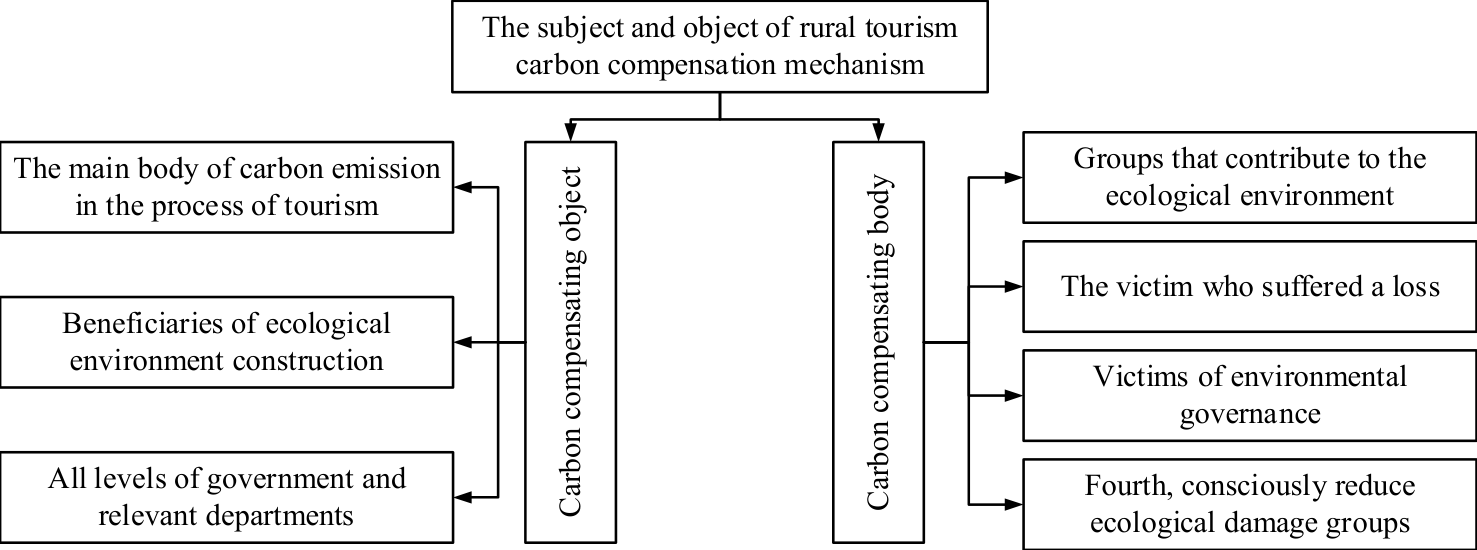
In Fig. 5., in line with the characteristics of rural tourism, from the CE perspective of rural tourism, the sectors that generate negative externality are the main body of CE. For example, departments or activities that cause CE, such as transportation, accommodation, food and solid waste during tourism, as well as residents’ daily lives [32]. In contrast, carbon sink groups, such as water wetlands, forest land, farmland, grassland and other groups that absorb CO2 and other greenhouse gases, that is, the sectors that generate positive externality are the main carbon sinks. The focus of carbon compensation lies in the social environmental effects ultimately generated by the CE behavior of various sectors of society. Due to the need to develop rural tourism, the CE behavior of various departments is bound to have an impact on the ecological environment. Generally speaking, the subject of ecological compensation is the beneficiary of ecological services, and the object is the provider of ecological services. Fig. 6. shows the composition of the subject and object of the rural tourism carbon compensation mechanism.
The subjects of carbon compensation in rural tourism are divided into three categories, one of which is the subject of CE in the tourism process [33]. In the course of delivering tourism services to visitors, the different divisions within rural tourism establishments generate a substantial volume of CE, thereby exerting an adverse influence on the ecological ecosystem. Consequently, it becomes imperative to shoulder the responsibility of environmental restoration and undertake carbon compensation measures. The second group comprises those who reap the benefits of ecological environment development [34]. As a result of the establishment and management of the ecological environment, the preservation of tourism resources has been ensured. The rural tourism sector can effectively exploit natural resources for economic gains, necessitating carbon compensation. The three entities involved include governmental bodies at various levels and pertinent departments [35], and in China, government compensation is mainly used. The development of rural tourism requires government support, and in compensation, some public goods or high CE companies require government intervention to ensure its smooth progress. There are four main types of carbon compensation objects for rural tourism, one is the group that contributes to the ecological environment [36]. Some groups, organizations, individuals, or enterprises that spontaneously contribute to carbon compensation need to be given appropriate rewards and compensation. The second is the victims who suffer losses due to ecological damage [37]. The third is the victim in the process of environmental governance. Victims need to be compensated to maintain their daily needs [38]. The fourth is the group that consciously reduces ecological damage [39]. The development of rural tourism has brought some opportunities to people. Some groups do not want to damage the ecology, but under survival pressure, they have to do so. Thus, to reduce CE, the government must subsidize them. The method of carbon compensation for rural tourism is listed in Fig. 7.
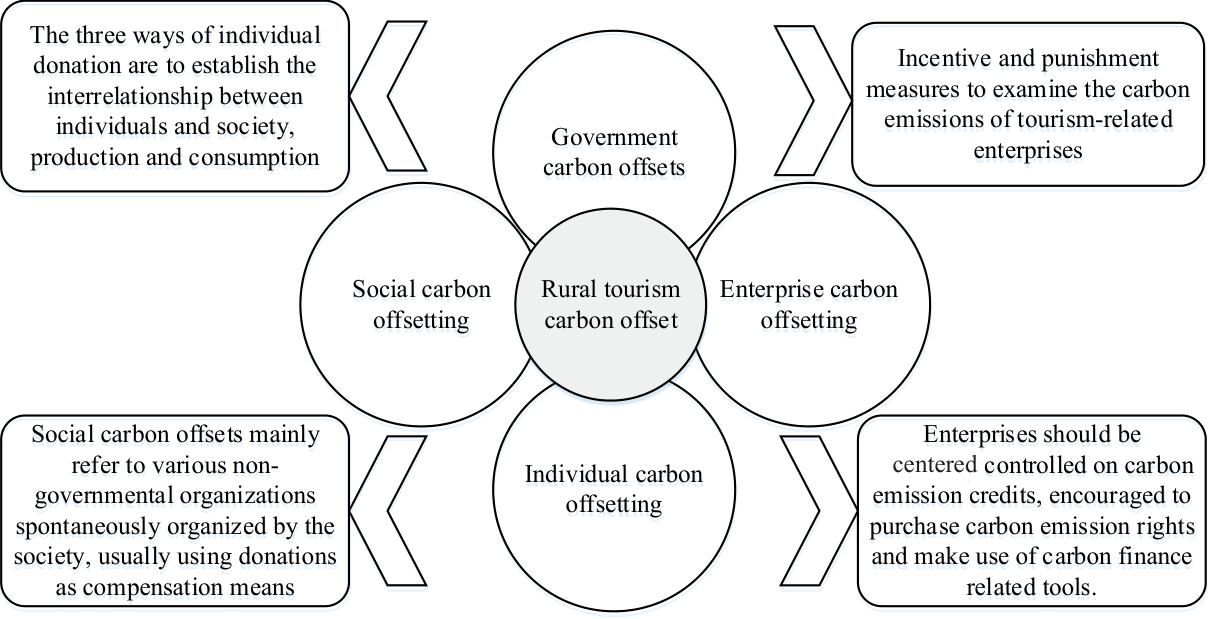
In Fig. 7, rural tourism carbon compensation usually includes government carbon compensation, enterprise carbon compensation, social carbon compensation, and individual carbon compensation [40]. In China, government carbon compensation plays a predominant role. It primarily involves employing reward and punishment mechanisms to investigate the CE of tourism-related enterprises and departments. Additionally, CE trading is utilized to effectively regulate the CE quota of enterprises, encouraging them to purchase CE rights and achieve independent emission reduction. Furthermore, carbon finance tools are employed, such as establishing a carbon foundation and imposing taxes on carbon-emitting entities [41]. By taxing high carbon-emitting enterprises, carbon compensation initiatives can be funded. Tourism-related enterprises can establish carbon compensation funds to incentivize tourists to participate in carbon compensation. This can be achieved by encouraging tourists to purchase lottery tickets and contribute to funds, thereby promoting their awareness of carbon reduction and aligning environmental benefits with their own interests. Social carbon compensation mainly refers to various non-governmental organizations that spontaneously form within society, often relying on donations as a means of compensation [42]. Non-governmental organizations can also provide low-interest loans to enterprises or individuals through micro-credit, offering them initial funds for engaging in carbon compensation activities and encouraging active participation. Individual carbon compensation can establish a symbiotic relationship between individuals and society, as well as production and consumption, through three methods: afforestation, carbon labeling, and individual donations, thus achieving the goal of carbon compensation to a certain extent [43]. Individual carbon compensation should be regulated more from a moral perspective, by strengthening publicity and education, improving the transparency of the use of carbon funds, and thus increasing the enthusiasm of individuals to participate in carbon compensation.
Results and Discussion
Yongtai Songkou Town capitalizes on its abundant historical and cultural artifacts, effectively integrating traditional cultural resources and agricultural production advantages. Consequently, it serves as an exemplary focal point for investigating CE in rural tourism development. This study categorizes the tourism-related carbon sources in Songkou Town, Yongtai into two distinct components: carbon sources associated with tourism development and carbon sources linked to local residents.
Empirical Result Analysis
The CE data of Songkou Town in Yongtai was obtained from relevant information from the local tourism bureau. The main modes of transportation for tourists to Songkou Town include high-speed trains, trains, cars, etc. According to relevant data, the average distance of external transportation, central transportation, and the proportion of people traveling to Songkou Town in 2022 were calculated, as shown in Table 1. [44-45].
In Table 1., the actual number of tourists received by Songkou Town in 2022 is 422,104. Among tourists traveling to Songkou Town, 51.05% of them use high-speed trains. Secondly, self-driving tours account for 35% of the total 98%. The main reason why most tourists choose high-speed trains for travel is that this mode of transportation costs less time and has a higher cost-effectiveness. And only during the transit process, tourists will consider cars. In addition, there are more tourists to Songkou Town within the province, accounting for 89.87%. Among them, Fuzhou has a significant number of tourists, accounting for 22.47% of the total number of people. Fig. 8. shows the CE
Table 1.
The average travel distance and proportion of tourists using various means of transport.
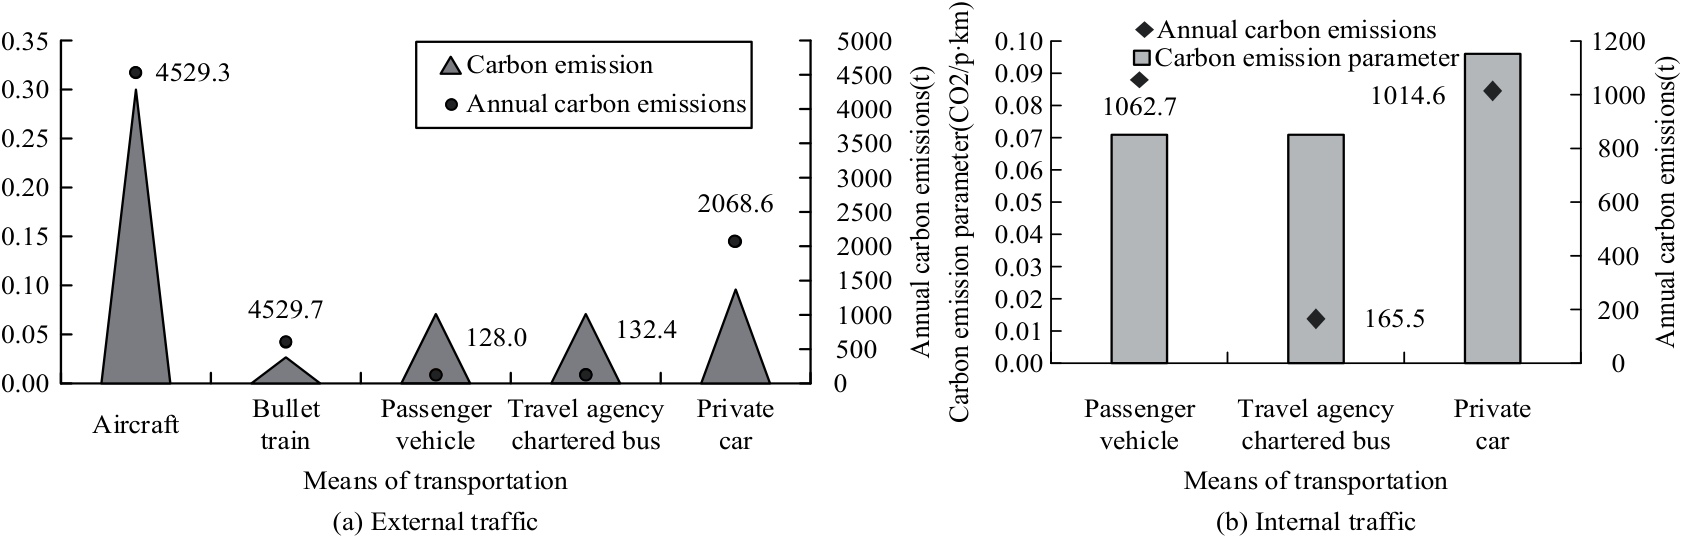
Carbon emission parameter(CO2/p·km) situation of tourism transportation in Songkou Town in 2022 [46-47].
From Fig. 8a)., among external means of transportation, the annual CE to Songkou Town by plane is the highest, at 4529.3 t. The annual CE through passenger cars is the lowest, at 128 t. The total annual CE of all external transportation for tourism in Songkou Town in 2022 is 7457 t. Among the central transportation vehicles in Fig. 8b)., the annual CE for taking passenger cars to Songkou Town is the highest, at 1062.7 t. The annual CE for charter cars through travel agencies is the lowest, at 165.5 t. The total central transportation CE of Songkou Town in 2022 is 2242.8 t. In summary, the actual total CE of tourism transportation in Songkou Town in 2022 is 9699.8 t. Table 2. shows the basic situation and per capita CE intensity of the tourism and accommodation industry in Songkou Town [48].
In Table 2., there are a total of 10 operating households for tourism accommodation, with 271 beds. The average occupancy rate of tourism accommodation in Songkou Town is 66.6%, with a total CE of approximately 60.96 t and a per capita CE intensity of 0.78 kg/visitor-night. Songkou Town is mainly composed of small restaurants and taverns, and the basic situation and CE intensity of its large tourism catering industry are listed in Table 3.
The number of large-scale restaurants in Songkou Town in Table 3. is 4, with 92 tables and a table occupancy rate of 82.25%. The average electricity consumption per household is 26798.35kWh, and the consumption of liquefied gas per household is 1000 kg, which is equivalent to 5007.8 kg of standard coal. The total CE of the large-scale tourism and catering industry in Songkou Town is 62898kg, with a one-time catering service CE intensity of 1.27. Table 4. shows the basic situation and CE intensity of the small-scale tourism and catering industry in Songkou Town [49].
The number of small catering establishments in Songkou Town in Table 4. is 6, with 31 tables and an occupancy rate of 84%. The average electricity consumption per household is 4640.01 kWh, and the consumption of liquefied gas per household is 370.83 kg, which is equivalent to 1331.1 kg of standard coal. The total CE of the large-scale tourism and catering industry in Songkou Town is 25078.5 kg, and the CE intensity of a single catering service is 1.37. Table 5. shows the CE of residents in Songkou Town [50].
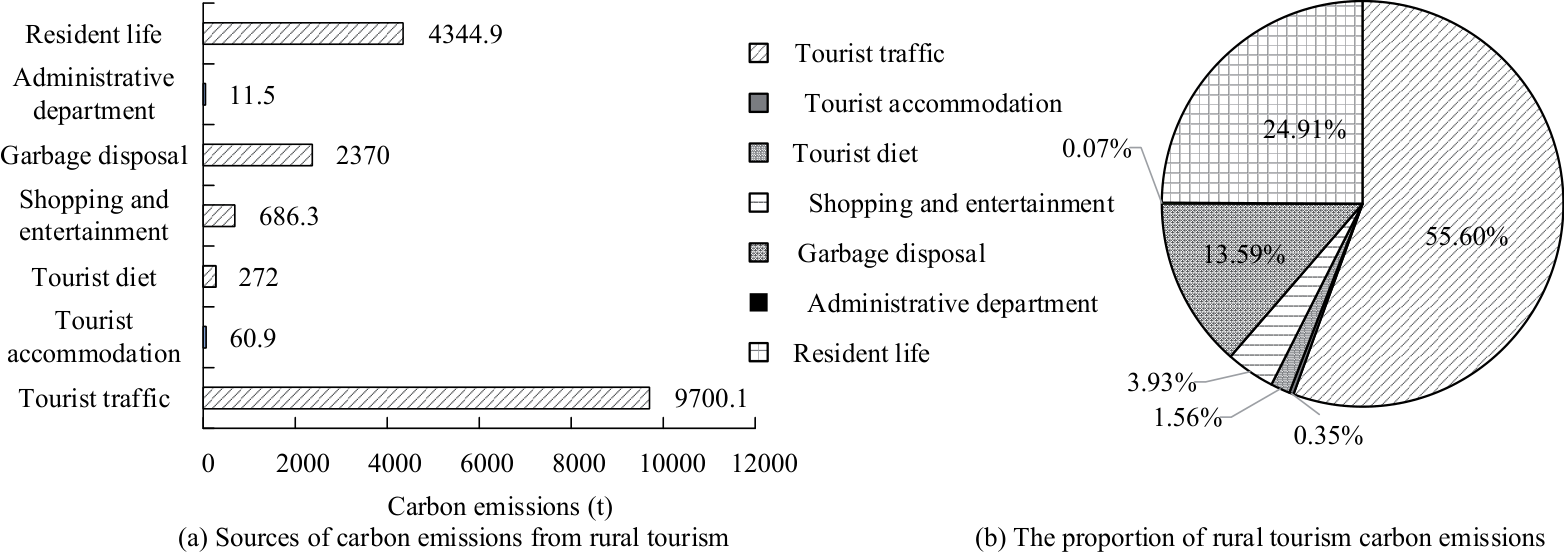
According to Table 5., the household energy usage of residents in Songkou Town is 2792 Kwh of electricity, 42.28 kg of liquefied gas, and 132.2 kg of firewood, with corresponding proportions of 27.41%, 21.73%, and 50.86%, respectively. The total CE of residents in this town is 4,344,880.2 kg. Fig. 9. shows the composition and proportion of rural tourism CE in Songkou Town.
Among the CE sources of rural tourism in Songkou Town in Fig. 9a)., the highest CE is tourism transportation, which is 9700.1 t. The lowest CE for the management department is 11.455 t. The proportion of rural tourism, transportation, accommodation, catering, shopping and entertainment, garbage disposal, management departments, and residents’ living in Songkou Town to the total CE is 55.60%, 0.35%, 1.56%, 3.93%, 13.59%, 0.07%, and 24.91%, respectively. Taking into account the factors such as distance, price, and time consumption, five scenarios are set up in the experiment. They are the conversion of an airplane to a high-speed train, the conversion of a passenger car to a private car, the conversion of a private car to a high-speed train, and the conversion of a private car to a passenger car, and the private cars increasing the occupancy rate. The reduced CE situation is demonstrated in Table 6.
Table 2.
Basic situation and per capita CE intensity of Songkou tourist accommodation industry.
Table 3.
The basic situation and CE intensity of large-scale tourism restaurant business in Songkou Town.
Table 4.
The basic situation and CE intensity of small-scale tourism restaurant business in Songkou Town.
Table 5.
Energy CE of Songkou Town residents.
In Table 6., when 20% of tourists switch from airplanes to high-speed trains, CO2 emissions decrease by 10.54%. When 20% of tourists switch from self-driving to high-speed cars, their CO2 emissions decrease by 3.94%. When 20% of tourists switch from self-driving to passenger cars, CO2 emissions decrease by 5.20%. When the self-driving occupancy rate increases by 20%, the CO2 emissions decrease by 11.78%. In summary, the public transportation system to tourist destinations must be strengthened to enable passengers to choose low-carbon transportation methods as much as possible. Meanwhile, it is necessary to increase the average occupancy rate of transportation vehicles, create advanced concepts of low-carbon travel, build a green tourism transportation system, and reduce CO2 emissions.
Table 6.
Carbon reduction in traffic of Songkou Town.
Discussion
In light of the CE associated with rural tourism in Songkou Town, the study not only incorporates widely applicable carbon compensation measures but also puts forth tailored strategies that align with the specific circumstances of Songkou Town. The government must strengthen the development of the public transportation system. Because buses are the main mode of transportation in Songkou Town, the travel time from Yongtai County to Songkou Town is approximately one hour. Consequently, regulating the energy consumption of vehicles and promoting the use of clean energy sources become crucial in mitigating CE. In Songkou Town, where a public transportation system is currently absent, it is worth considering the promotion of bicycles due to the close proximity of various scenic areas. By encouraging the use of bicycles, not only can the transportation needs of tourists be met, but also a reduction in CO2 emissions can be achieved. To facilitate low-carbon development in rural tourism, it is essential to establish comprehensive and enforceable laws and regulations. These legal frameworks will guide local enterprises and departments in implementing energy conservation and emission reduction measures in their tourism projects. Incentives such as reward policies and tax reductions can be introduced to encourage enterprises that prioritize low-carbon tourism practices, while taxes and fees can be imposed on those that neglect such principles. The promotion of low-carbon concepts should primarily target both local residents and tourists, harnessing the involvement of residents to drive sustainable practices in the tourism industry.
The disposal method of garbage in Songkou Town is to transport it to Hongmiaoling in Fuzhou for power generation, which has the disadvantage of long transportation distance. Therefore, an additional waste treatment transfer station can be set up to collect the waste in Songkou Town in a centralized manner. Providing power for the loading and unloading of garbage through electricity can effectively reduce the CO2 emissions generated by fuel consumption. Energy conservation and emission reduction technologies should be vigorously promoted and used. The main body of rural tourism CE in Songkou Town involves tourism accommodation and catering industries, and advanced energy-saving technologies should be adopted in the planning of tourism accommodation and catering construction. In terms of energy use, it can also rely on the advantages of rural areas to build septic tanks with biomass energy, such as livestock manure and crop straw, to reduce the use of firewood and liquefied gas. In this way, excessive energy consumption and increased CE can be avoided, ultimately achieving low-carbon operation.
In Songkou Town, tourism-related enterprises can be categorized into three main sectors: tourism accommodation, tourism catering, and shopping and entertainment. It is imperative to incorporate green energy practices into the operational processes of these sectors, offering environmentally friendly services to tourists and promoting the concept of green tourism. In the realm of catering services, it is essential to provide green and pollution-free fruits and vegetables that are unique to rural areas, offering tourists the opportunity to savor green cuisine rarely experienced in urban settings. Choosing distinctive and hygienic rural hotels for accommodation not only reflects the characteristics of the ancient town, but also allows tourists to immerse themselves in the fun of rural agricultural life during their stay. In the domain of shopping and entertainment, it is recommended to show Songkou Town’s unique handicrafts and distinctive green food to tourists. In addition, arrange more experiential entertainment projects, such as local dramas, acrobatics, sports, etc. These projects are safe, pollution-free, and culturally rich, allowing tourists to gain a deeper understanding of the local rich cultural heritage. By ensuring that all services are consistently aligned with the principles of low-carbon tourism, a holistic and sustainable tourism experience can be provided.
Conclusion
The growth of the tourism sector inherently leads to CE, and the concept of low-carbon tourism aligns with the contemporary imperative for sustainability. The integration of low-carbon practices throughout the entire tourism industry is essential to mitigate its carbon footprint and achieve the objective of low-carbon tourism. On the basis of the existing carbon source theoretical framework, this study constructed a relatively complete rural tourism carbon source theoretical system. It further developed a CE system, estimation methodology, and proposed appropriate carbon compensation strategies. Taking Songkou Town as the empirical analysis object, in-depth analysis was conducted on its CE sources. The results showed that among the sources of CE from rural tourism in Songkou Town, the highest CE was tourism transportation, which was 9700.1t. The lowest CE for the management department was 11.455t. The proportions of transportation, accommodation, catering, shopping and entertainment, garbage disposal, management departments, and residents’ living in rural tourism in Songkou Town to the total CE were 55.60%, 0.35%, 1.56%, 3.93%, 13.59%, 0.07%, and 24.91%, respectively. When 20% of tourists switched from airplanes to high-speed trains, CO2 emissions decreased by 10.54%. When 20% of tourists switched from self-driving to high-speed cars, their CO2 emissions decreased by 3.94%. When 20% of tourists switched from self-driving to passenger cars, their CO2 emissions decreased by 5.20%. When the self-driving occupancy rate increased by 20%, the CO2 emissions decreased by 11.78%. In summary, it is necessary to strengthen the public transportation system to tourist destinations, so that passengers can choose low-carbon transportation methods as much as possible. Furthermore, the study put forth appropriate carbon compensation strategies that align with the specific CE scenario observed in the tourism industry of Songkou Town. Nevertheless, it is important to acknowledge that the on-site investigation process may introduce certain deviations in the collected data due to subjective factors associated with the respondents. Consequently, future research endeavors will prioritize enhancing data accuracy to ensure more reliable and robust findings.

