

Introduction
With the rapid development of the dyestuff industry, the variety of dyestuff is increasing year by year. Methylene blue (MB) dye is a typical cationic dye, often used as a biological stain, especially in the staining of bacteria and cells [1]. Methylene blue is also widely used as a chemical indicator, dye, and drug [2]. Methylene blue dye is alkaline in aqueous solution, toxic, and difficult to degrade in the environment. When methylene blue dye comes into direct contact with people, it may cause damage to the skin, eyes, respiratory system, etc., and may even cause cancer [3]. The current methods for treating MB dye wastewater include coagulation and precipitation, biosorption, membrane separation and advanced oxidation [4-5]. The biosorption approach is widely used in dye wastewater treatment because of its low cost, simple operation, large specific surface area, and high stability compared with the traditional adsorption method [6-7].
Activated carbon is a typical representative of porous carbon materials, which has become one of the most commonly used adsorbents as well as the first porous carbon material to be industrially applied [8]. In recent years, domestic and foreign scholars have begun to study the search for cheap and readily available biomass-activated carbon, such as reed, straw, bark, and nut shells, which have sound adsorption effects [9-10]. The reed straw is a high-quality raw material for preparing activated carbon because of its well-developed aeration tissue and high fiber content, and the straw contains up to 44% carbon [11]. China’s reed cultivation area is more than 3 million mu, with a mu output of 500-100 kg and an annual output of more than 3 million tons [12]. Activated carbon prepared from reed can effectively adsorb pollutants such as dyes, heavy metals, and organic matter [13-14]. Zhou et al. [15] prepared activated carbon with high adsorption properties from reeds from the Yellow River Delta. The maximum adsorption capacity of reed activated carbon obtained from the Langmuir isotherm equation was 704.23 mg/g at 30 °C. Its high adsorption capacity can be attributed to its low polarity, multiple surface functional groups, high surface area and pore volume, and layered porous structure. Karoui et al. [16] reported that by developing an enhanced reed biochar as an adsorbent, the removal of MB was 100% at an adsorbent dosage of 1.55 g/L, an MB dosage of 75 mg/L, a pH of 10.42, and a contact time of 115.28 min.
In this study, to further improve the adsorption effect, the reed activated carbon was modified with metal salts. The advantages of metal salt modified adsorbents can improve the pore size structure, improve the stability, and enhance the adsorption performance of some specific pollutants [17]. The disadvantages are that the preparation process is complicated and the cost is high [18]. Among the many metal salts, magnesium chloride and ferric chloride are often used as modifiers for activated carbon based on their efficient modification effect, relatively low cost, and environmental friendliness [19]. Based on the advantages of synergistic effect, modulation of modification effect, and cost reduction when the two modified materials are mixed, the mixture of magnesium chloride and ferric chloride is used to modify the reed activated carbon [20-21].
Therefore, in this paper, the modified reed activated carbon (M-RAC) was prepared and activated by a physicochemical method using MgCl2 and FeCl3 as raw materials and synergistic activation. The effects of M-RAC dosage, MB concentration, adsorption time, and oscillation velocity on MB adsorption were investigated using the Box-Behnken module of Response Surface Methodology (RSM), and the optimized preparation conditions were obtained. Combined with the results of the optimized experimental conditions, the adsorption process of M-RAC on MB was analyzed in depth by adsorption isotherm, adsorption kinetics, and adsorption thermodynamics to provide valuable references for the improvement of the waste utilization of straw and the treatment of MB dye wastewater.
Materials and Methods
Preparation of M-RAC
The M-RAC used in this study was purchased from Yancheng City, Jiangsu Province, China. The dried reed was first cleaned to remove the surface adhesion and then air-dried, and the dried reed was sieved into a porcelain crucible, compacted, sealed with a lid, and put into a muffle furnace and heated to 500 ℃ at a constant temperature of 7 ℃/min for 2 h. After the temperature was reduced to room temperature, it was taken out, milled, and passed through a sieve of 0.15 mm to make the powdered biocarbon.
Reed activated carbon was modified with a mixture of MgCl2 and FeCl3 under the following conditions: room temperature of 25 ℃, MgCl2 concentration of 0.5 mol/L, FeCl3 concentration of 0.04 mol/L, pH=4, and the modification time of 24h. 2g of reed biochar was put into a 100 mL vinyl centrifuge tube with a stopper, added with 60 mL of the abovementioned mixture, and shaken well. After this process, put it into the constant temperature oscillator at 25 ℃, set the vibration speed of 200 r/min, oscillate for 30 min, soak for 24 h, take out and filter, dry in 105 ℃ drying oven for 48 h to dry thoroughly, cool down and then store in a sealed bag in the desiccator for spare.
RSM Design
The RSM experiments were designed using the Box-Behnken module in DesignExpert software. The Box-Behnken design requires fewer experiments, has no axial points, and is safer in practice [22]. Based on the results of the previous one-factor experiments, a total of 30 experimental conditions were designed based on the four-factor and three-level experimental design scheme with the four factors of M-RAC dosage (0.06~0.18 g), MB concentration (300~600 mg/L), adsorption time (30~150 min), and oscillation velocity (120-180 r/min) as the independent variables. Quadratic regression analysis was performed to obtain the optimized adsorption conditions using the adsorption capacity of M-RAC for MB as the response value. The influencing factors and values are shown in Table 1.
Calculation of Adsorption Volume
In this experiment, the adsorption amount of MB was used as an index to evaluate the adsorption performance of M-RAC. The corresponding mass of M-RAC was accurately weighed in an electronic balance and placed in a conical flask containing 250 mL of the corresponding MB concentration. After the adsorption experiment, the conical flask was precipitated for 10 min, and the supernatant was taken and filtered through a 0.45 μm filter membrane. The absorbance of the solution was measured at 470 nm with a UV-visible spectrophotometer. The remaining concentration of MB solution was calculated from the standard curve, and then the adsorbed amount of MB, q, was calculated according to the mass of M-RAC added, as shown in Equation (1).
Where q is the adsorption amount of MB, mg/g; C0 is the concentration of MB solution before adsorption, mg/L; C1 is the concentration of MB after adsorption, mg/L; V is the volume of solution in the conical flask, L; m is the amount of M-RAC dosage, g.
Adsorption Isotherm Test
In order to gain insight into the adsorption process, the nature of the adsorbent, and the interaction between the adsorbent and the adsorbent, the Langmuir and Freundlich adsorption isotherms were tested. Referring to the optimization results of the response surface, 100 mL of MB solution with concentrations of 50 mg/L, 100 mg/L, 150 mg/L, 200 mg/L, 300 mg/L, 400 mg/L, 500 mg/L, and 700 mg/L were added to eight 250 mL order conical flasks with 0.12 g of M-RAC at 288 K, 298 K and 308 K at three temperatures, and the adsorption isotherms were studied by oscillating in a water bath shaker at 150 r/min for 105 min.
Two commonly used isothermal adsorption models, Langmuir and Freundlich, were chosen to fit the experimental data with linear and nonlinear data. The linear expressions of these two equations are shown in (2) and (3), respectively.
Where the qe is the adsorption amount at equilibrium time, mg/g;
Adsorption Kinetics Test
Concerning the optimization results of the response surface, 100 mL of MB solution at a concentration of 450 mg/L was added to each of the 11 sets of 250 mL conical flasks. Then 0.12 g of M-RAC was added, and the flasks were oscillated in a water-bath shaker at a speed of 150 r/ min. Samples were taken at 5, 10, 20, 30, 50, 70, 90, 120, 150, 180 and 240 min for adsorption kinetic studies.
The commonly used Pseudo-first-order and Pseudo-second-order kinetic models were selected for fitting and analyzing the experimental data, and the fitting equations are shown in Equations (4) and (5), respectively.
Where t is the contact time, min; qe is the amount of M-RAC adsorbed at equilibrium, mg/g; qt is the amount of M-RAC adsorbed at time t, mg/g; k1 is rate constant for Pseudo-first-order kinetics, min-1; k2 is rate constant for Pseudo-second-order kinetics, g/(mg-min).
Adsorption Thermodynamics
In order to gain insight into the nature of the adsorption process, the adsorption of M-RAC on MB was thermodynamically investigated to understand the energy changes at different temperatures. The thermodynamic parameters determined were Gibbs free energy (ΔG0, kJ/mol), enthalpy change (ΔH0), and entropy change (ΔS0, J/(mol·K)). Thermodynamic calculations of the M-RAC adsorption MB process were performed using Equation (6-8) [23].
Where Kc is the thermodynamic equilibrium constant; Cad is the concentration of adsorbate on the adsorbent at adsorption equilibrium, mg/L; Ce is the concentration of residual MB at adsorption equilibrium, mg/L;ΔG0 is the Gibbs free energy, kJ/mol; R is the gas constant, 8.314 J/ (mol·K); T is the absolute temperature, K; and ΔH0 is the enthalpy change of adsorption, kJ/ mol; ΔS is the entropy change of adsorption, J /( mol·K).
Analysis Method
The MB concentration was determined at a maximum wavelength of 470 nm using a UV-VIS spectrophotometer (Alpha-1506, Shanghai Puyuan, China). The response surface test design, regression equation, and optimization analysis were performed using Design Expert (8.0.6, Stat-Ease Inc, USA) software. Graphs of adsorption properties were plotted using origin (2022, Electronic Arts Inc, USA).
Results and Discussion
Optimization of Adsorption Parameters
Adsorption Capacity and Variance Analysis
The results of the RSM experimental design for specific working conditions and corresponding response values are shown in Table 2. In order to investigate the effects of M-RAC dosage, MB concentration, adsorption time, and oscillation velocity on the removal of MB dye by M-RAC adsorption, multiple quadratic regressions were fitted to the data using Design Expert, and ANOVA analyzed the resulting model results. The regression equation for this experiment is shown in Equation (6). Y = 3 7 7 . 6 8 + 3 7 . 8 2 X 1+ 3 6 . 2 1 X 2+ 2 4 . 1 4 X 3+ 1 1 . 5 6 X 4- 1 1 . 4 0 X 1X 2+ 9 . 8 8 X 1X 3+ 6 . 5 8 X 1X 4 + 2 . 0 3 X 2 X 3 + 1 5 . 1 9 X 2 X 4 - 1 . 7 7 C D - 8.23X12-0.0005.417X22-102.44X32-29.88X42 (6)
The positive coefficients of all four factors in Equation (2) indicate that all four factors can cause an increase in the adsorption value. In the interaction, the negative coefficients of factors X1 and X2, X3 and X4 indicate that they can cause a decrease in the response value.
Analysis of variance was performed on the model, and the results showed that F =57.94, P<0.0001, reached a highly significant level (P ≤ 0.01) in the constructed regression model. Lack of fit was not significant (P =0.5242>0.05), indicating that the model was reliable [24]. The R-squared was 98.18%>85%, indicating that the model fits well with the experimental results. Its predicted values can replace the experimental values in describing the relationship between the factors and the response values. The Adj R2 was = 0.9649, and the difference with R2 was less than 0.2, indicating that the model is reasonable. The coefficient of variation is 3.77%<10%, which indicates that the non-experimental factors are weakly interfering and the experimental stability of the model is good [25]. Therefore, this Equation can be used to analyze and predict the effects of various factors on the adsorption of MB by M-RAC.
Table 2.
Experimental design and adsorption capacity analysis
It can be seen that the primary terms X1, X2, X3, X4 and the interaction terms X1 X2, X2 X4, X32, and X42 had significant effects on the adsorption capacity of M-RAC by the sum of squares statistics. In addition, from the sum of squares of different factors in Table 3, it can be seen that the order of the four factors on the adsorption capacity of M-RAC adsorption for MB was as follows: the M-RAC dosage > MB concentration > adsorption time > oscillation velocity.
Parameters Interaction Analysis
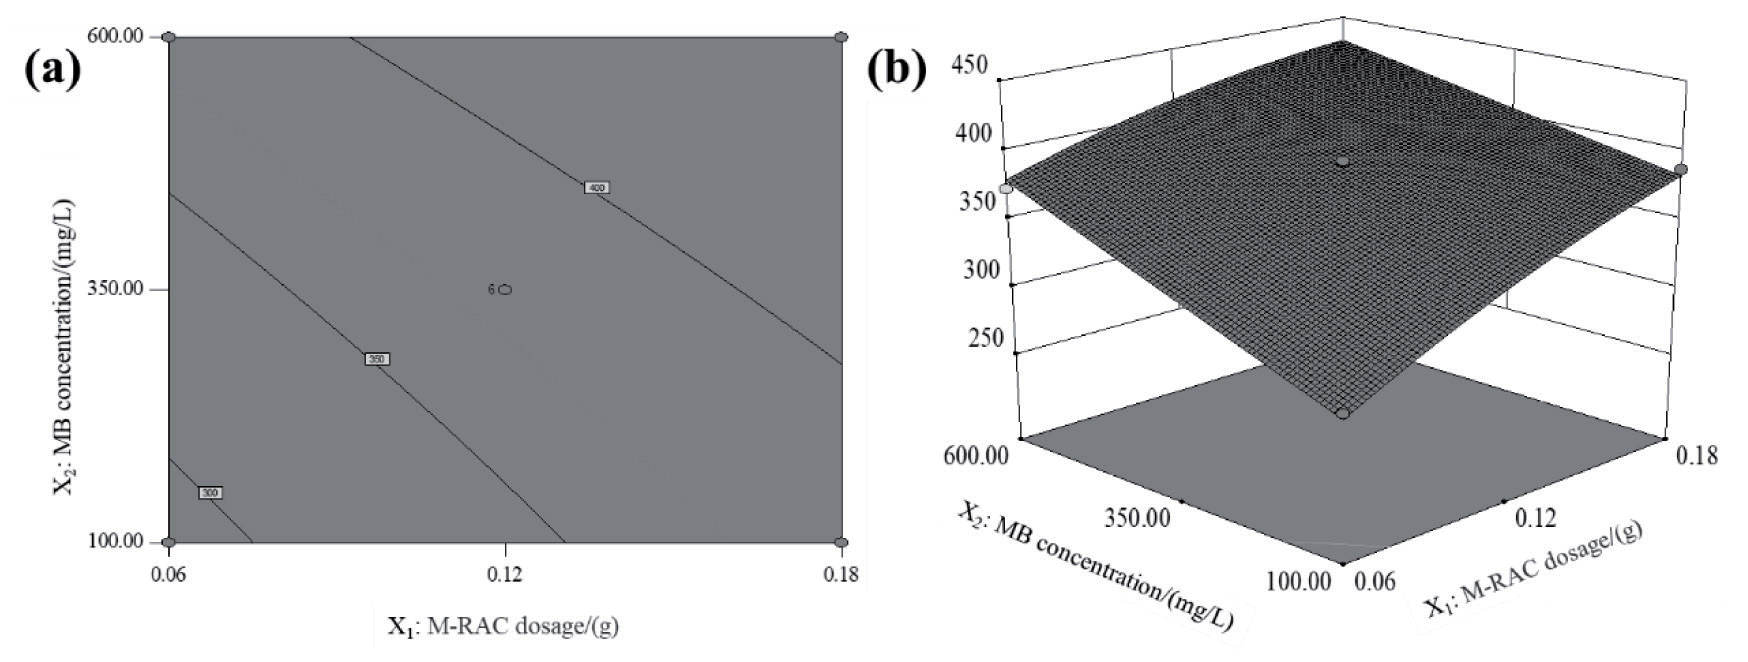
According to ANOVA, it is clear that in the interaction of four factors, the P value is less than 0.05, only factors X1 X2 (0.0458), X2 X4 (0.0243). Therefore, the response surface analysis was performed only for these two groups of factors. The three-dimensional graphs and two-dimensional contour plots of the interaction between M-RAC dosage and MB concentration on MB adsorption are shown in Fig. 1. The positive effects of M-RAC dosage and MB concentration on the experimental results are shown in Fig. 1. The M-RAC dosage and MB concentration positively affected the experimental results. The MB adsorption amount showed an increasing trend with the increase of M-RAC dosage and MB concentration. The maximum MB adsorption was observed when the M-RAC dosage was 0.18 g, and the MB concentration was 600 mg/L (experimental condition 26). The increase of M-RAC dosage, on the one hand, led to the introduction of more adsorption active sites, which made the contact area between the M-RAC and MB increase, and on the other hand, made the diffusion resistance of MB on the surface of the M-RAC decrease, which was favorable to the adsorption of MB [26-27]. However, an excess of M-RAC may also lead to an increase in the resistance of the activated carbon bed and subsequently weaken the adsorption of MB.
Table 3.
Response surface model results and variance analysis
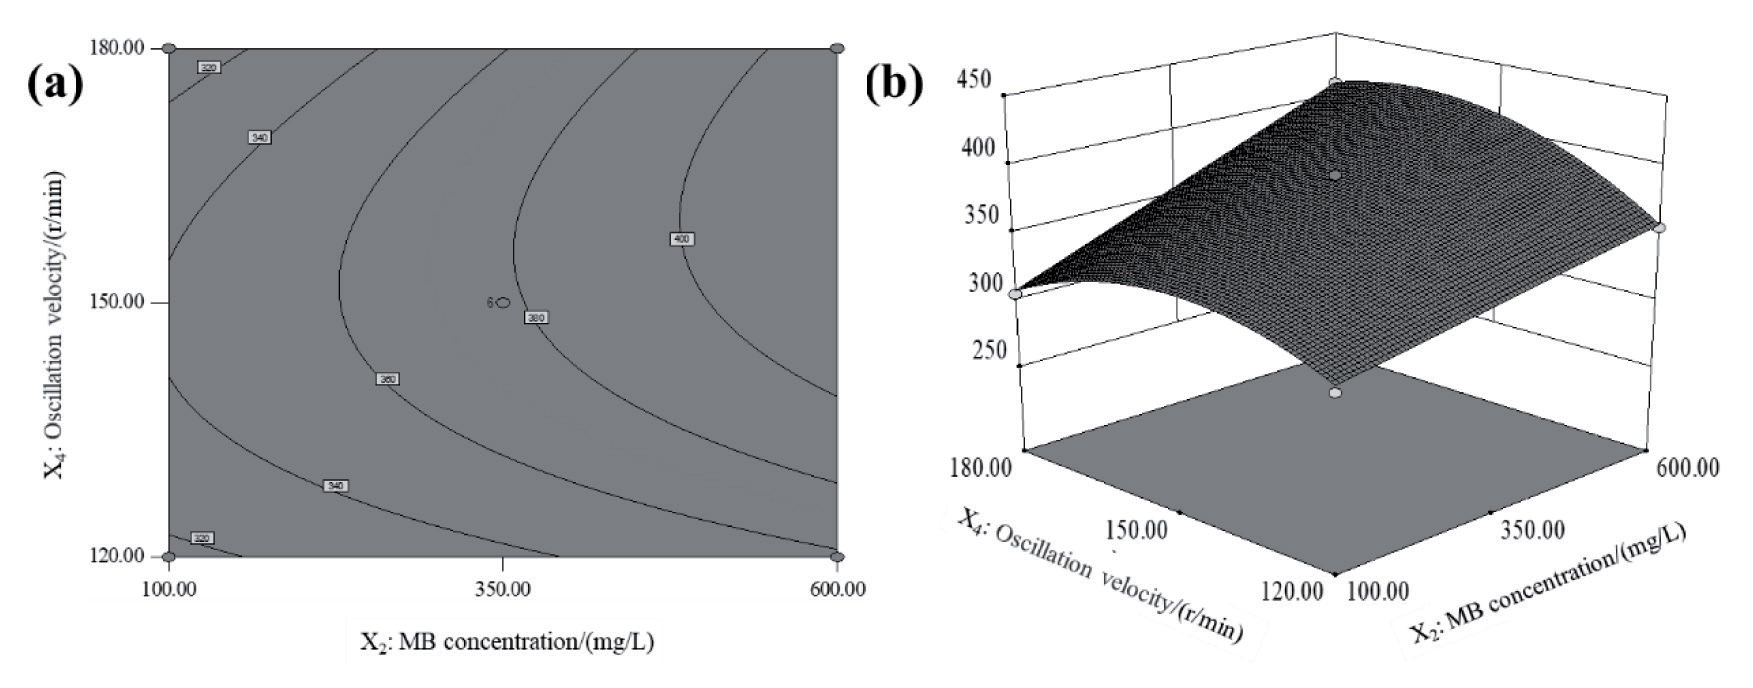
Three-Dimensional Graphs and Two-Dimensional Contour Plots of the effect of the interaction of MB concentration and oscillation velocity are shown in Fig. 2. With the increase of MB concentration, the MB adsorption amount showed an increasing trend. However, the best adsorption of MB by M-RAC was observed when the oscillation velocity was at 150 r/min, and the adsorption effect was not as good as the median value when the oscillation velocity was equal to 120 r/min and 180 r/min. The diffusion coefficient of MB on the surface of M-RAC may increase when the oscillation velocity is too large, making it difficult for MB to stay on the surface of M-RAC for a sufficient period and affecting the adsorption effect [28]. The contact time between M-RAC and MB may not be sufficient when the oscillation velocity is too low, and the diffusion coefficient of MB on the surface of M-RAC may be smaller, thus affecting the adsorption effect [29].
Optimization Validation
The optimal adsorption levels of the four factors for the adsorption of MB dye by M-RAC were obtained by the optimization module in the Design-Experts 8. 0. 6 software: M-RAC dosage of 0.17 g, MB concentration of 550 mg /L, adsorption time of 105 min, oscillation velocity of 154 r/min.
The average adsorption capacity of M-RAC for MB under this optimal adsorption condition was 436.33 mg/g. In order to test the reliability of the optimal adsorption capacity of M-RAC, three parallel experiments were carried out under the optimal adsorption level of the four factors. The validation results showed that the average adsorption capacity of M-RAC for MB under the optimal adsorption level was 427.17 mg/g, with an error of 2.06% from the predicted value, indicating that the test results based on the present RSM method were accurate and reliable. Compared with the results of other literature, the removal rate of MB is moderately high [13, 15-16].
Adsorption Isotherms
The initial concentration of MB was 50-600 mg/L, and the dosage of M-RAC was 1.2 g/L. The conical flasks were shaken at 150 r/min for 105 min to adsorption equilibrium in a constant temperature water bath shaker. The adsorption performance of M-RAC on MB was examined at different MB concentrations and temperatures.
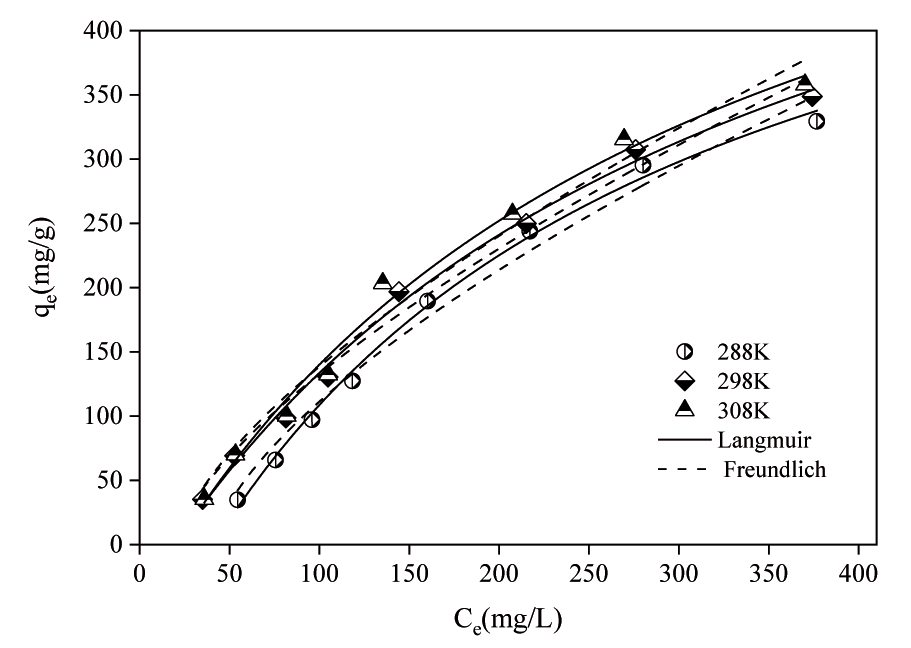
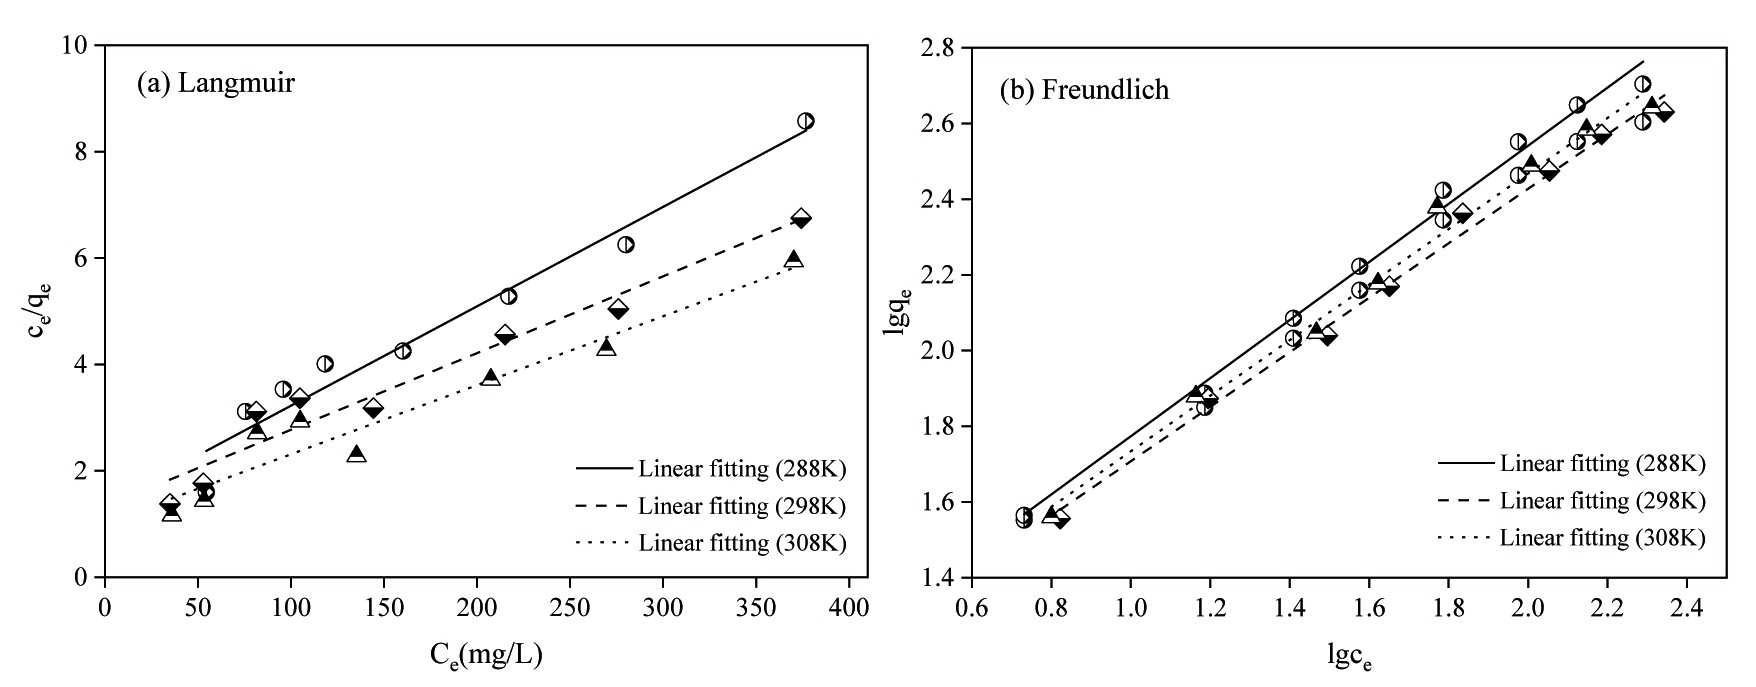
Fig. 3 shows the adsorption change process of M-RAC on MB at three different temperatures, 288, 298, and 308 K. The adsorption of M-RAC on MB is shown in Fig. 3 and Table 4. From Fig. 3 and Table 4, it can be seen that the adsorption of MB by M-RAC increased gradually with increasing temperature, which indicates that the adsorption process is heat-absorbing (Fig. 4). The increase in temperature promotes the adsorption process. In comparing the two models, the correlation coefficients R2 obtained from the Langmuir model at different temperatures were 0.9956, 0.9943, and 0.9897, while those of the Freundlich model were 0.9807, 0.9856, and 0.9768. Although the correlation coefficients of the two models were higher, the Langmuir model had a better fitting effect. It indicates that the Langmuir model can better simulate the adsorption process of M-RAC on MB. It can be seen that the adsorption of M-RAC on MB occurs on the surface of the adsorbent, and the adsorption is dominated by monolayers, with few multilayers stacking or aggregation, as well as few interactions or competitions between MB molecules [30]. In the Freundlich model, the KF value showed a positive correlation with the temperature (Table 4), indicating that the adsorption capacity of M-RAC was enhanced by the increase in temperature, which also indicated that the adsorption of MB by M-RAC was a heat-absorbing process.
Adsorption Kinetics
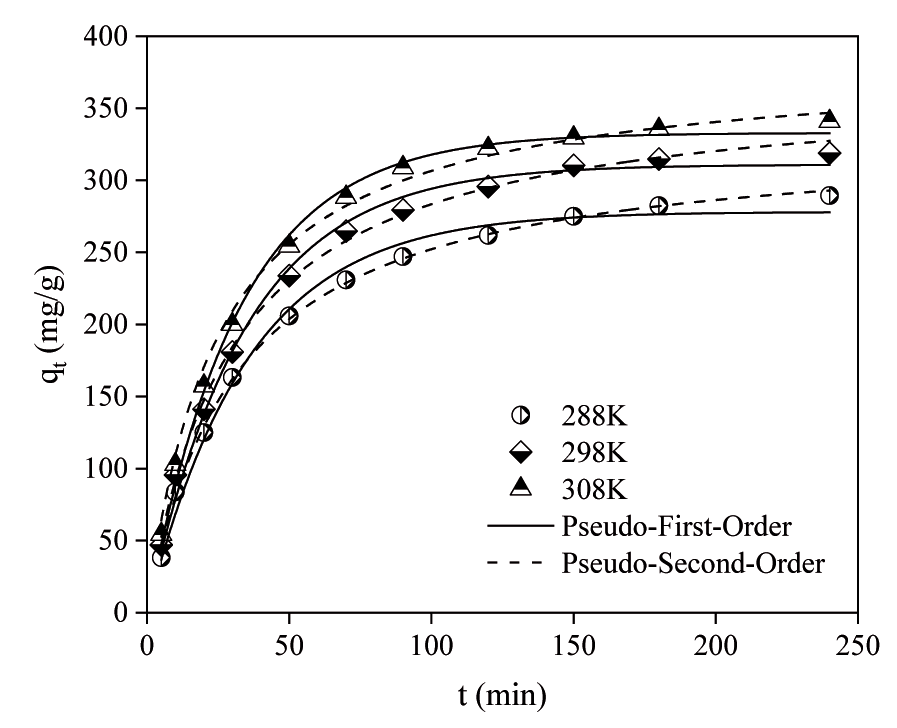
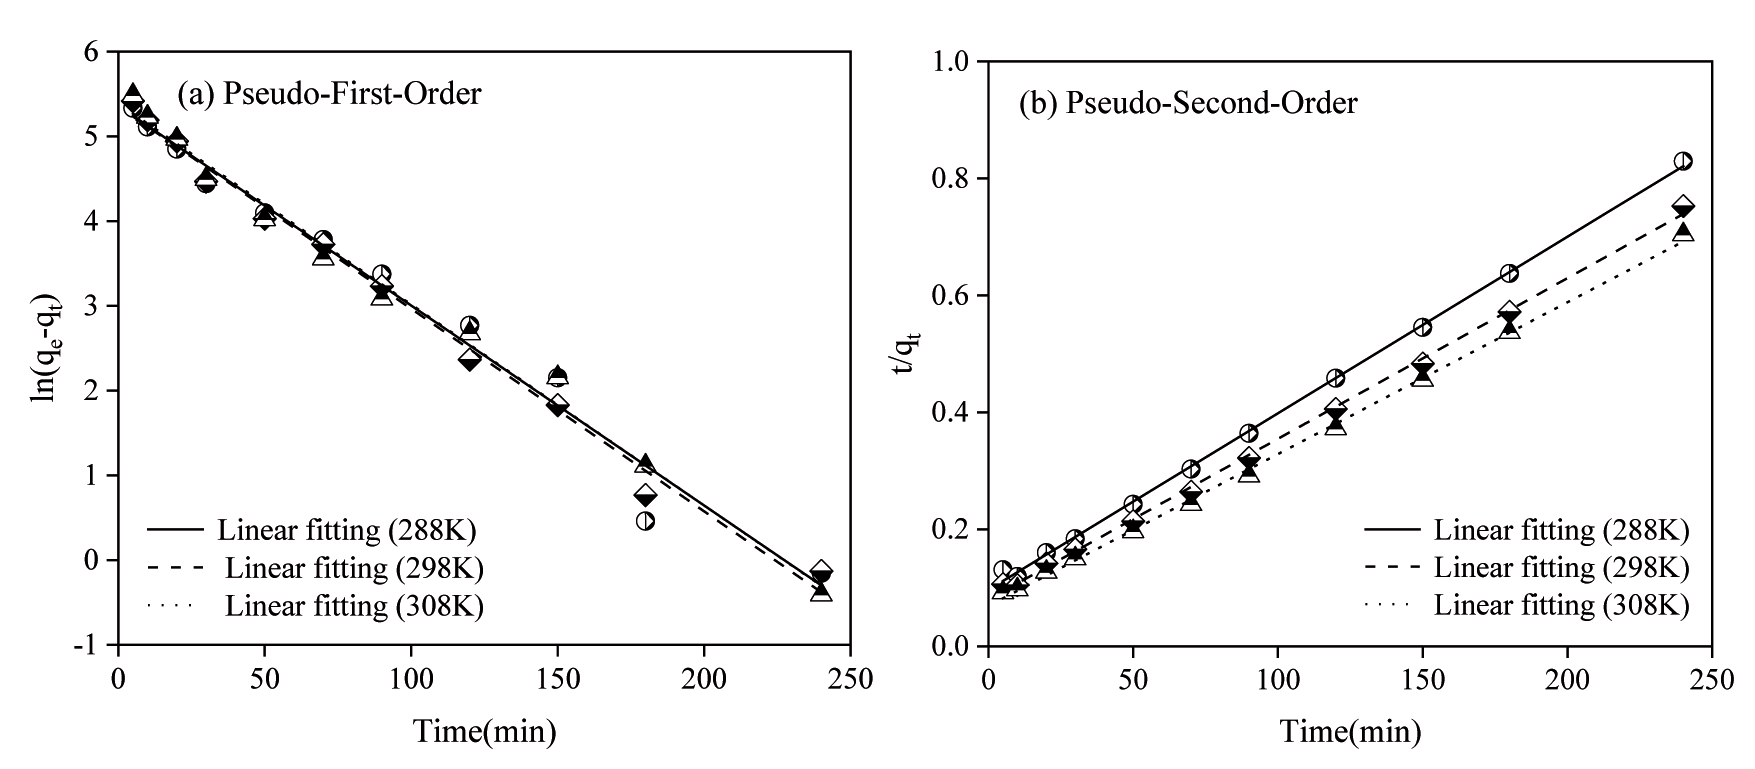
In the kinetic experiments, the initial concentration of MB was 450 mg/L, and the dosage of M-RAC was 1.2 g/L. The effects of different temperatures and adsorption times on the adsorption process of MB were examined (Fig. 5). As shown in Table 5, the qe,cal value (the theoretical value of qe) of the Pseudo-first-order kinetic model was lower than the actual value, and the correlation coefficient was slightly lower than that of the Pseudo-second-order kinetic model, which indicated that the Pseudo-first-order kinetic model was not suitable for describing the adsorption process of M-RAC on MB. The qe,cal values of the Pseudo-second-order kinetic model are closer to the actual values, and the correlation coefficients are above 0.98, indicating that this model is more suitable for describing the adsorption process of M-RAC on MB (Fig. 6). In the adsorption process of M-RAC on MB, physical adsorption and diffusion are complementary, and chemical adsorption is dominant [31]. This adsorption process may involve: 1) the formation of ions or dipole molecules between dye molecules and M-RAC through electron transfer; 2) the ions in MB may complex with some ions on the surface of reed activated carbon to form stable complexes; 3) the hydroxyl or other groups on the surface of reed activated carbon may form hydrogen bonds with MB molecules, which results in adsorption [32-33]. The k and qe,cal values of the Pseudo-first-order and Pseudo-second-order kinetic models increased with the adsorption temperature, indicating that warming could accelerate the adsorption of MB by M-RAC.
Adsorption Thermodynamics
In Table 6, ΔG0<0 indicates that the process of MB adsorption by M-RAC is spontaneous. When the temperature was incremented, ΔG0 increased from -17.68 kJ /mol to -18.73 kJ /mol and -19.59 kJ /mol, suggesting that increasing the temperature promotes the adsorption [34]. The ΔH0=16.76 kJ/mol, indicating that the adsorption process absorbs heat and that increasing the temperature facilitates the adsorption, which agrees with experimental results of adsorption isotherm. The ΔS0=0.9536 kJ·mol- 1K-1, indicating that the degree of freedom of the solid-liquid surface increases during adsorption [35]. The above experimental data indicated that the adsorption of MB by M-RAC proceeded spontaneously and was accompanied by an increase in the system’s energy.
FTIR Analysis
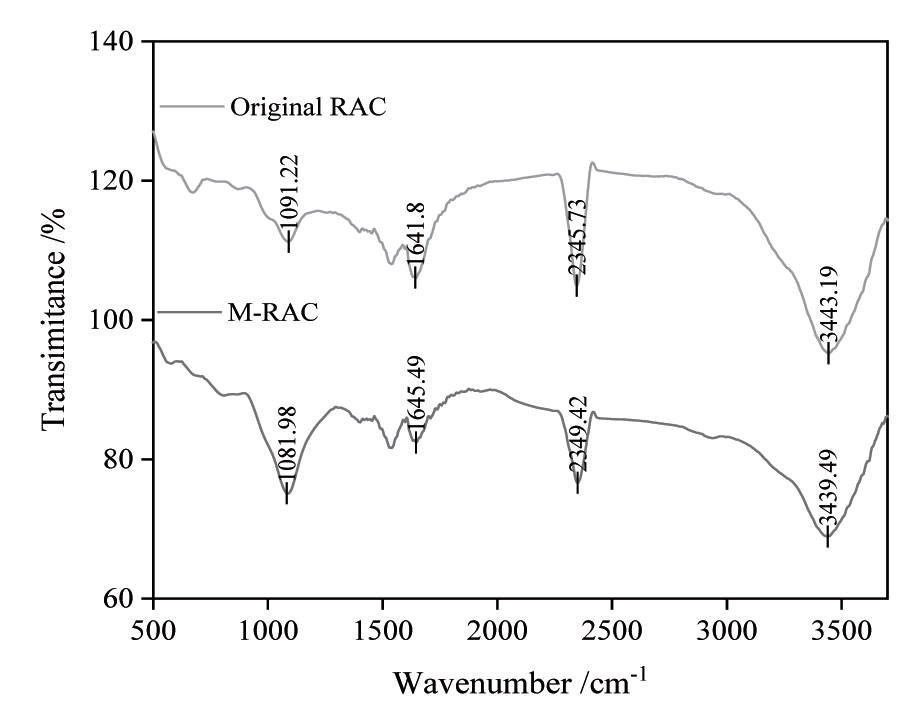
In the adsorption kinetic analysis, it is known that the Pseudo-second-order kinetic model is more suitable to describe the adsorption of MB by M-RAC. Therefore, the activated carbon surface was explored for chemical group changes by performing an FTIR spectroscopy analysis of the original RAC and M-RAC.
The surface functional groups of original reed biochar and activated charcoal are similar but slightly different (Fig. 7). 3439 cm-¹ is the location of the hydroxyl (-OH) stretching vibration peak, which is shown to be sharp and intense, indicating the presence of free hydroxyl groups in the molecule [36]. Near 2349 cm-¹ corresponds to the free C-H stretching vibration absorption peak. Near 1645 cm-¹, this wave number is usually associated with C=O stretching vibrations, such as carboxyl, ester groups, etc. Near 1081 cm-¹, this wave number is usually associated with C-O stretching vibration, such as alcohols, phenols, ethers, etc. [37]. The M-RAC has a significant absorption peak near 3439 cm-¹, which suggests that the chloride ions may be chemically reacted with the hydroxyl group and other functional groups on the surface of the activated carbon in the process of preparing activated carbon at high temperatures with the powder of reed straw—chemical reaction. Compared with the original carbon, the characteristic peak near 1081 cm-1 of M-RAC is enhanced, indicating that the modification process generated more C-O stretching vibration absorption peaks.
Conclusions
(1) The experimental results of the RSM showed that the optimal adsorption parameters of modified reed activated carbon were: M-RAC dosage of 0.17 g, MB concentration of 550 mg/L, adsorption time of 105 min, and oscillation velocity of 154 r/min. Under these conditions, the adsorption capacity of MB by M-RAC was 436.33 mg/g, and the error with the predicted value was 2.06%, which indicated that the experimental results based on the present RSM method were accurate and reliable.
(2) The theoretical maximum adsorption of MB by Langmuir isothermal adsorption curve at 308 K temperature was 491.61 mg/g (R2 =0.9897), which was better fitted with the adsorption process. The secondary kinetic adsorption curve can better describe the adsorption kinetic process of M-RAC on MB (R2>0.9800). The adsorption thermodynamics indicated that the thermodynamic results showed that the adsorption process was spontaneous (-ΔG0), heat absorption (ΔH=16.76), entropy increase (ΔS=0.9536), and dominated by chemisorption.
(3) The results of FTIR analysis showed that the absorption peaks of hydroxyl functional groups in the prepared M-RAC were more apparent. In contrast, the C-O characteristic peaks were enhanced compared with those before modification. The results of the adsorption study validate the M-RAC as a suitable adsorbent for water treatment.

